4.0 $\gamma - \gamma$ coincidence data analysis

  1. gamma-gamma 符合分辨时间,timewalk correction
  2. 多探测单元探测器的addback
  • Source: $^{152}Eu+^{133}Ba$

  • Detectors: Eurica Array: 12 Cluster Detectors

  • Electronics: 100Mhz, 14bit DGF-4C digitizer: energy , time 25ns/bin

  • Trigger: 1kHz Clock

  • Energy & time window: $100\mu s$ before trigger.

  • timing: leading edge discrimination for fast trigger.

  • Data
    • eurica.root
    • Branch:
    - ghit, gid[ghit], ge[ghit], gt[ghit];// sorted by gid value in ascending order
      - ahit, aid[ahit], ae[ahit], at[ahit];//addback
    
  - 所有探测器的相对时间延迟已经校正
In [1]:
TCanvas *c1 = new TCanvas("c1","c1");
TFile *fin = new TFile("eurica.root");
TTree *tree1 = (TTree*) fin->Get("tree");
In [2]:
tree1->Scan("gid:int(gid/7):gid%7:ge:gt","","",5,1);
***********************************************************************************
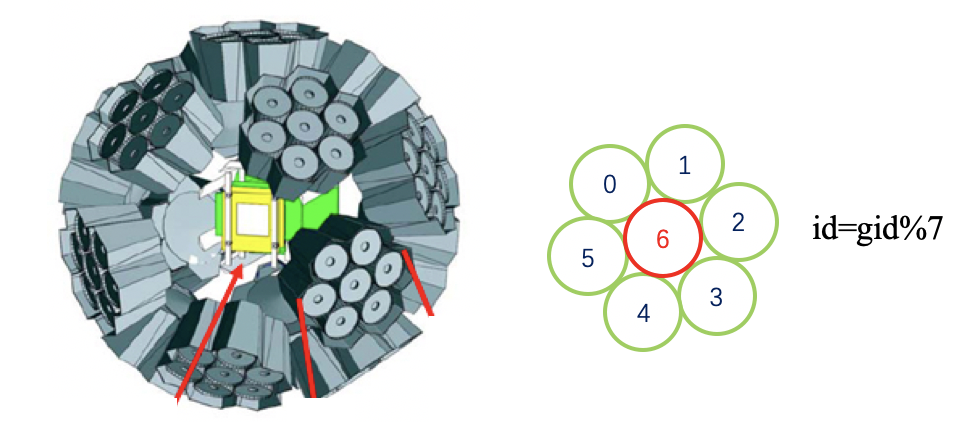
*    Row   * Instance *       gid * int(gid/7 *     gid%7 *        ge *        gt *
***********************************************************************************
*        1 *        0 *        38 *         5 *         3 * 355.39204 * -17058.86 *
*        1 *        1 *        78 *        11 *         1 * 252.57337 * -52075.91 *
*        2 *        0 *        22 *         3 *         1 * 721.78308 * -23301.26 *
*        2 *        1 *        24 *         3 *         3 * 69.567794 * -23329.60 *
*        2 *        2 *        27 *         3 *         6 * 187.30067 * -23277.87 *
*        2 *        3 *        28 *         4 *         0 * 166.66361 * -17738.86 *
*        2 *        4 *        32 *         4 *         4 * 73.365846 * 4244.7660 *
*        2 *        5 *        37 *         5 *         2 * 856.34057 * -17667.32 *
*        2 *        6 *        41 *         5 *         6 *  121.9316 * -5041.272 *
*        2 *        7 *        44 *         6 *         2 * 257.20985 * -5065.583 *
*        2 *        8 *        79 *        11 *         2 * 679.46405 * -84233.31 *
*        2 *        9 *        80 *        11 *         3 * 595.97674 * -84263.73 *
*        3 *        0 *         4 *         0 *         4 * 345.00679 * -88546.18 *
*        3 *        1 *        17 *         2 *         3 * 94.129311 * -88728.07 *
*        4 *        0 *         5 *         0 *         5 * 287.14200 * -91794.79 *
*        4 *        1 *         8 *         1 *         1 * 302.35514 * -19152.93 *
*        4 *        2 *        69 *         9 *         6 * 37.762305 * -36942.37 *
*        5 *        0 *        45 *         6 *         3 * 232.74277 * -59180.04 *
*        5 *        1 *        75 *        10 *         5 * 334.94150 * -38333.97 *
***********************************************************************************
In [3]:
tree->Draw("int(gid%7):int(gid/7)>>(12,0,12,6,0,6)","","colz");
c1->SetLogz(0);
c1->Draw();
In [4]:
tree->Draw("ge>>h1(1000,0,1000)","","");
c1->SetLogy();
c1->Draw();

time walk

  • 前沿定时的timewalk:
    • 幅度越小,timewalk越大。幅度大到某一值时timewalk可以忽略。
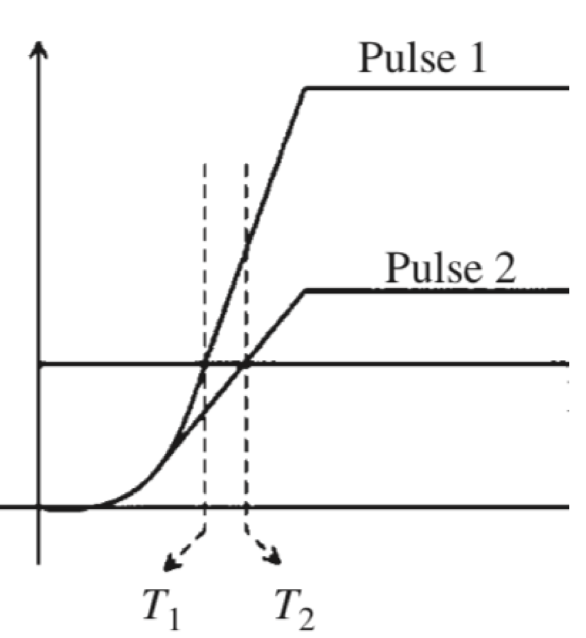
- CFD在信号幅度较小时也有timewalk

两个探测器的时间差分布

In [5]:
tree->Draw("ge[0]:gt[0]-gt[1]>>(100,-1000,1000,1000,0,1000)","ge[0]>50 && ge[1]>50","colz");
c1->SetLogz();
c1->SetLogy(0);
c1->Draw();

排除参考时间路gt[1]的timewalk

  • 选择ge[1]>500的条件,去掉gt[1]的timewalk的影响
In [6]:
tree->Draw("ge[0]:gt[0]-gt[1]>>h1(80,-1000,1000,200,0,1000)","ge[1]>500","colz");
c1->SetLogz();
c1->Draw();

timewalk correction

  • 消除定时点的幅度依赖
  • 观察walk与能量的函数关系,进行修正。
  • 每一个探头应该单独修正。

Profile histograms are used to display the mean value of Y and its error for each bin in X. The displayed error is by default the standard error on the mean (i.e. the standard deviation divided by the sqrt(n) ). Profile histograms are in many cases an elegant replacement of two-dimensional histograms.

TProfile * TH2::ProfileY( const char *name = "_pfy",
                          Int_t firstxbin = 1,
                          Int_t lastxbin = -1,
                          Option_t * option = "" 
                         ) const
  • 拟合范围 e>50

拟合walk与幅度的函数关系

  • 原则上,应去除时间差在 $\pm 1\sigma$ 以外的非瞬发关联事件后进行拟合
In [7]:
c1->Clear();
TF1 *f1 = new TF1("f1","[0]+[1]/pow(x,0.5)+[2]/pow(x,1)+[3]/pow(x,2)",50,1000);
h1->ProfileY("hpf1");
hpf1->Fit("f1","R");
c1->Draw();
 FCN=342.908 FROM MIGRAD    STATUS=CONVERGED      96 CALLS          97 TOTAL
                     EDM=5.37172e-14    STRATEGY= 1      ERROR MATRIX ACCURATE 
  EXT PARAMETER                                   STEP         FIRST   
  NO.   NAME      VALUE            ERROR          SIZE      DERIVATIVE 
   1  p0          -3.25398e+01   8.08377e+00   2.79661e-03   9.63089e-07
   2  p1           2.38689e+03   2.86430e+02   3.80138e-02   7.67892e-08
   3  p2          -4.26580e+04   2.70829e+03   4.46362e-01   6.59028e-09
   4  p3           9.81220e+05   6.29167e+04   3.41786e+01   5.85795e-11
In [8]:
tree->SetAlias("y","ge[0]");
tree->SetAlias("x","gt[0]-gt[1]");
tree->SetAlias("t","x-(-32+2.387e3/pow(y,0.5)-4.2658e4/pow(y,1)+9.8122e5/pow(y,2))");
In [9]:
c1->Clear();
tree->Draw("y:t>>h2(200,-1000,1000,1000,0,1000)","ge[1]>500 && ge[0]>50","colz");
c1->SetLogz();
c1->Draw();

对每路时间信号进行walk修正。

In [10]:
tree->SetAlias("t","gt-(-32+2.387e3/pow(ge,0.5)-4.2658e4/pow(ge,1)+9.8122e5/pow(ge,2))");
tree->SetAlias("t0","gt[0]-(-32+2.387e3/pow(ge[0],0.5)-4.2658e4/pow(ge[0],1)+9.8122e5/pow(ge[0],2))");
tree->SetAlias("t1","gt[1]-(-32+2.387e3/pow(ge[1],0.5)-4.2658e4/pow(ge[1],1)+9.8122e5/pow(ge[1],2))");
In [11]:
tree->Draw("ge[0]:t0-t1>>h2(200,-1000,1000,1000,0,1000)","ge[1]>50 && ge[0]>50","colz");
c1->Draw();

符合时间窗

  • 符合时间窗的宽度一般取 $ 3\sigma= \pm 180$ns
  • 如果统计足够可以去更窄的符合时间窗
  • 注意窄的符合时间窗的选取可能会丢掉一部分低能gamma的符合事件。
In [12]:
c1->Clear();
tree->Draw("t0-t1>>h3(200,-1000,1000)","ge[1]>50 && ge[0]>50","colz");
h3->Fit("gaus");
c1->SetLogy(1);
c1->Draw();
 FCN=82118.4 FROM MIGRAD    STATUS=CONVERGED     121 CALLS         122 TOTAL
                     EDM=1.66667e-08    STRATEGY= 1      ERROR MATRIX ACCURATE 
  EXT PARAMETER                                   STEP         FIRST   
  NO.   NAME      VALUE            ERROR          SIZE      DERIVATIVE 
   1  Constant     5.56148e+04   8.95455e+01   8.44908e+00  -2.62981e-06
   2  Mean        -1.78008e-01   6.60671e-02   9.24389e-03  -6.63648e-04
   3  Sigma        6.08437e+01   7.23086e-02   2.27119e-05  -1.05100e+00

探测器单元间符合关系

  • 二维图中计数最多的方块显示gid之间的关联关系
  • 0-6 中 (0,1);(1,2);(2,3);(3,4);(4,5);(0,5);(0-5,6) 之间有很强的关联
    • 与探测器中探测单元的位置关系一致
In [13]:
TCut gtcoin = "abs(t0-t1)<180";//coincidence time window
tree->Draw("gid[1]:gid[0]>>(21,0,21,21,0,21)",gtcoin,"colz");
gStyle->SetOptStat(0);//off statistics box
c1->SetLogy(0);
c1->Draw();

同一探测器相邻探测单元之间能量关联

  • 可以看到相邻探测单元的大部分关联事件是由一个$\gamma-$射线在相邻单元间的康普顿散射引起的。
In [14]:
TCut gdet = "int(gid[0]/7)==int(gid[1]/7)";//same detector
TCut gidadj = "abs(gid[0]%7-gid[1]%7)==1|| gid[0]%7==0 && gid[1]%7==5 || gid[1]%7==6";//adjacent crystals
tree->Draw("ge[0]:ge[1]>>(1000,0,1000,1000,0,1000)",gtcoin&&gdet&&gidadj,"colz");
c1->Draw();

相邻探测单元关联-时间差不在符合时间窗内

  • 显示为非物理关联事件,偶然符合
  • 偶然符合特征:
  • 当在x探测单元有强度较强的能量为$E_x$的$\gamma-$射线时,会形成$y=E_x$的连续直线,即$E_x$与y探测器任意能量都有关联。
  • 上述x,y上的直线之间的交叉点的计数为x,y方向直线平均计数之和。
  • 除了个别情况外, 大部分情况下 ($𝐸_𝑥=𝐸_𝑦$) 的点是由偶然符合引起的。
In [15]:
TCut gdet = "int(gid[0]/7)==int(gid[1]/7)";//same detector
TCut gidadj = "abs(gid[0]%7-gid[1]%7)==1|| gid[0]%7==0 && gid[1]%7==5 || gid[1]%7==6";//adjacent crystals
tree->Draw("ge[0]:ge[1]>>(1000,0,1000,1000,0,1000)",!gtcoin&&gdet&&gidadj,"colz");
c1->Draw();

不相邻探测单元之间能量关联

  • 不相邻单元之间由compton散射引起的gamma-gamma关联,相比相邻情况显著减少。
  • 在$E_x\neq E_y$处的交叉点为真正的gamma-gamma符合(级联的两个gamma分别入射到两个探测器)
In [16]:
tree->Draw("ge[0]:ge[1]>>(1000,0,1000,1000,0,1000)",gtcoin&&gdet&&!gidadj,"colz");
c1->Draw();

符合事件窗内 相邻单元 ge[0], ge[1]的能谱 - 图(a)

  • 很高的低能本底
In [17]:
tree->Draw("ge[0]>>h1(1000,0,1000)",gtcoin&&gdet&&gidadj,"colz");
TH1F *h1 = (TH1F*)gROOT->FindObject("h1");
h1->SetLineColor(kGreen);
tree->Draw("ge[1]>>h2(1000,0,1000)",gtcoin&&gdet&&gidadj,"colz");
h1->Draw("same");
c1->Draw();

addback

  • 多单元探测器中相邻单元之间存在能量共享(compton)
  • 为了减少康普顿平台,相邻单元之间的能量应该相加

相邻探测器的addback

In [18]:
tree->Draw("ge[0]+ge[1]:ge[0]>>(1000,0,1000,1000,0,1000)",gtcoin&&gdet&&gidadj,"colz");
c1->Draw();

addback: 符合事件窗内ge[0]+ge[1]能谱- 图(b)

  • 峰计数显著增加(与图(a)对比)
In [19]:
tree->Draw("ge[0]+ge[1]>>(1000,0,1000)",gtcoin&&gdet&&gidadj,"colz");
c1->Draw();

Addback之后的不同探测器的能量关联

In [20]:
tree->SetAlias("at","at-(-32+2.387e3/pow(ae,0.5)-4.2658e4/pow(ae,1)+9.8122e5/pow(ae,2))");
tree->SetAlias("at0","at[0]-(-32+2.387e3/pow(ae[0],0.5)-4.2658e4/pow(ae[0],1)+9.8122e5/pow(ae[0],2))");
tree->SetAlias("at1","at[1]-(-32+2.387e3/pow(ae[1],0.5)-4.2658e4/pow(ae[1],1)+9.8122e5/pow(ae[1],2))");
In [21]:
TCut atcoin = "abs(at0-at1)<180";//coincidence time window
tree->Draw("ae[0]:ae[1]>>(1000,0,1000,1000,0,1000)",atcoin,"colz");
c1->Draw();

addback 前后能谱对比

  • addback之后低能本底减少,高能峰计数增加
In [22]:
tree->Draw("ge>>h1(200,0,200)","","colz");
TH1F *h1 = (TH1F*)gROOT->FindObject("h1");
h1->SetMinimum(10000);
tree->Draw("ae>>h2(200,0,200)","","colz same");
TH1F *h2 = (TH1F*)gROOT->FindObject("h2");
h2->SetLineColor(kRed);
c1->SetLogy(0);
c1->Draw();
In [23]:
tree->Draw("ge>>h1(200,700,900)","","colz");
TH1F *h1 = (TH1F*)gROOT->FindObject("h1");
h1->SetMinimum(1000);
h1->SetMaximum(60000);
tree->Draw("ae>>h2(200,700,900)","","colz same");
h1->SetLineColor(kRed);
c1->SetLogy(0);
c1->Draw();

Addback 注意事项

  • 除了一个探测器内相邻单元之外,几何上相邻的不同探测器的探测单元之间也可以做addback。

  • 当源与探测器之间距离较远时,不同gamma射线进入相邻探测单元的几率很小,相邻探测器的关联主要是compton散射,进行addback可以提高探测器的peak-compton ratio

  • 当源与探测器之间距离很近时,不同gamma射线进入相邻探测单元的几率大大增加,此时addback会将两个gamma射线能量相加,造成假的gamma峰。

    • 比如$E_{\gamma 1}$与$E_{\gamma 2}$入射到相邻探测单元,addback会消除$E_{\gamma 1}$与$E_{\gamma 2}$位置的峰,造成假的加合峰$E_{\gamma}=E_{\gamma 1}+E_{\gamma 2}$
  • 一般情况下应该同时保留各个探测单元的事件以及addback的事件,分析时注意对比addback前后的数据,避免addback的副作用。